
Cohort analysis: retention
One of the best metrics for identifying whether users love your product is retention. It tells you whether the visitors, which you worked so hard to acquire, are going to come back. Retention evaluation nicely highlights the advantages of a cohort analysis. Unfortunately, while this startup metric can be invaluable, cohort analysis in Google Analytics requires some work to set up.
The graph below shows the daily distribution of visitors who start using your product in each of three separate weeks.
-
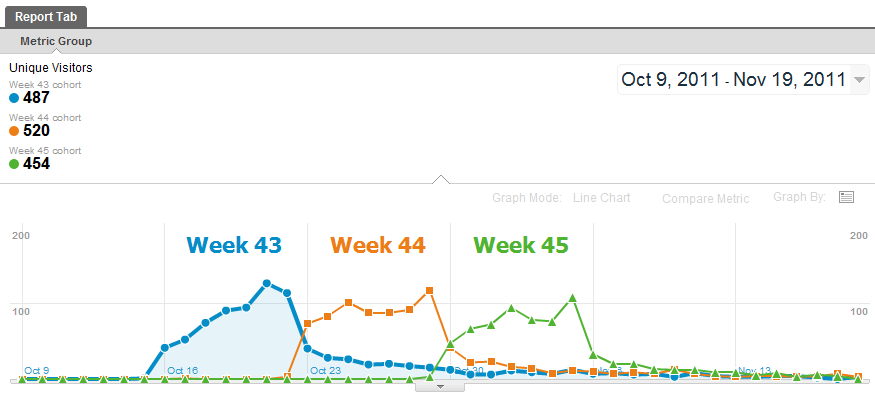
- Visitor counts by day for each of 3 weekly cohorts
There are numerous ways to calculate the week of the year. The week index reported by Google Analytics is based on a system that’s common in North America: each week starts on a Sunday and the first week of the year is the one containing a Saturday. This is in contrast to the ISO 8601 date and time standard popular in many countries (including most of Europe) that specifies Monday as the start of the week and the first week of the year as the one containing the first Thursday.
Take a look at the blue line in the above graph. When the new week starts, visitors are tagged and counted as members of the Week 43 cohort. By mid-week, the number of unique visitors to your product tends to rise as some of those acquired earlier in the week come back. Depending on your traffic, the cohort count may peak on the last day of the week. On the next day, visitors begin to be assigned to the next cohort group (Week 44), shown in orange above. Without the constant injection of new visitors each day, the visit contribution from the Week 43 cohort falls off dramatically and then decays slowly. Keeping this decline in check is what retention is all about. Retention analysis makes the long-term value of the newly acquired visitors abundantly clear.
There are better ways to visualize how well you’re retaining new visitors. In the cohort example below, each interval shows the users retained as a percentage of the initial visit.
-

- Cohort retention by day as a percentage of initial visit
What does a graph like this tell us? First of all, it says that a large percentage of the first-time users of our product do not return the day after they try it. After that, users tend to leave at a much lower, but consistent rate. In other words, if a user returns once or (better) twice then they are reasonably likely to keep doing so. As it turns out, this is a reasonably common observation that’s valid across a number of product types and analysis intervals.
For example, the graph below is taken from a Mixpanel blog post on the importance of tutorials in social games.
-
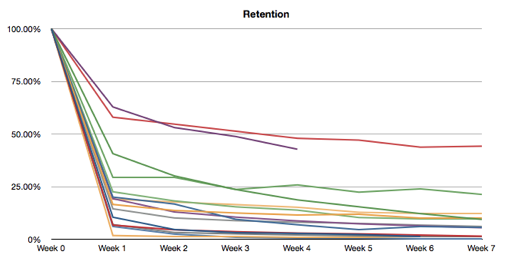
- Retention trends for various social games (source: Mixpanel Blog)
Each line represents the weekly retention of a different social game. Obviously the one week retention varies significantly among these titles. Notice, however, that the retention is mostly flat after that first week. Again, initial engagement is critical for long-term retention.
Cohort analysis: engagement
Grouping users into cohorts based on their signup date can also be used to measure changes in engagement. It’s much easier to make informed decisions about new features and refinements when you can correlate cohort behavior changes in your startup analytics with product alterations. For example, you can determine if users that sign up now are more likely to tell a friend about your product than users that signed up a month ago. By combining this with a split test, in which you, say, offer a new sharing feature to only half of your users, you’ll better understand whether improvements can be attributed to the introduction of the new feature.
Let’s look at a cohort data analysis example. In early November you decide to remove a few seemingly redundant instructions from your web service explaining how users can connect and share with their friends. Now you want to ensure that the change was benign. The graph below is a non-cohort trend of your referral rate. This metric consistently hovers around 30%, showing that the changes made to your product during this time have not had a significant effect on referrals. Phew!
-
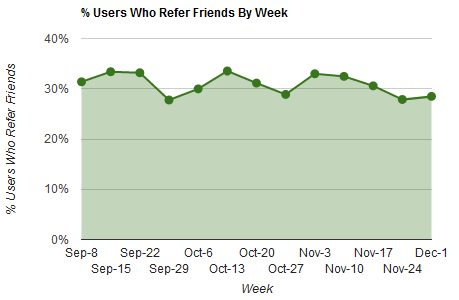
- Graph of referral rate by week (non-cohort)
However, while it may be true that the overall referral rate hasn’t changed significantly, it’s possible that your large returning user base (of visitors who read your referral instructions before they were removed) are masking the impact of your change. While there are other approaches, the cleanest way to chart the impact of your change is to use a basic cohort analysis. Instead of plotting the percentage of users who refer their friends each week, we’ll instead graph the percentage of users who sign up each week and then, at some point in the future, decide to refer their friends. This allows us to consistently focus on the experience of new users who aren’t tainted by prior experience with the product.
-

- Graph of referral rate by weekly cohort
Looking at the cohort for September 1st in the graph above, we would read the data like this: 30% of users who signed up during the week of September 1st eventually decided to refer their friends. There’s an important distinction between this and the previous graph: the users from each weekly cohort who refer friends may do so in the week that they join or any week thereafter. This means that the values for each weekly cohort will continue to change over time.
This is different from cohort retention analysis where the period over which a user may return is usually fixed. Of course, you should feel free to limit the engagement analysis window to whatever is appropriate for your application. It’s possible, for example, that friend referrals from a weekly cohort are only valuable in your product if they occur within 2 weeks of the user signing up.
The cohort graph reveals a couple of things that weren’t obvious in the non-cohort analysis:
- Starting the week of September 22nd, the referral rate of each weekly cohort consistently exceeded the average referral rate. Is this statistically significant? What changed? If it’s something you did then you need to do more of it.
- Something tragic happened in early November. Perhaps your change wasn’t as benign as you thought or maybe the correlation is coincidental. In any case, there’s a clear need to investigate further.
In both cases, a key performance metric for your startup changed substantially but it was masked by the size of your existing user base. In the same way, it’s possible for a large proportion of new users to mask changes in your existing user base. The cohort analysis uniquely clarifies these changes by tuning your focus to the user groups that provide the most insight into the impact of product changes.

Pingback: How to do Cohort Analysis in Google Analytics | Jonathon Balogh
Pingback: Quora
Pingback: Citação – Michael Karnjanaprakorn « Startup Biz Model
Pingback: How to do Cohort Analysis in Google Analytics | Jonathon Balogh
Pingback: Founders Dictionary | Cohort Analysis
Pingback: Cohort analysis in a nutshell | A blog about behavioral economics, crowdfunding, crowdsourcing, gamification and more
This is a great overview. We created a site to explain cohorts analysis and show how to do a simple one in Excel at http://cohortanalysis.com/
thanks for connecting us, but can you show how cohort analysis is can be calculated please??
Hey neymer, I do a few cohort analysis calculations in the next post: https://jonathonbalogh.com/2012/04/01/how-to-do-cohort-analysis-in-google-analytics/
Very illuminating. Thank you!
Pingback: Primer to Building Products in a Lean Startup » taigeair taigeair
Pingback: Web App Analytics Checklist | Dirty AnalyticsDirty Analytics
Great article! Many thanks for sharing. Just noting a small typo in the 3rd paragraph. It should be: “On the next *week, visitors begin to be assigned to the next cohort group (Week 44), shown in orange above.”
Simple and great explanation! Thanks
How was this visualization generated , the one tagged “The week 3 cohort appears to be more likely to stick with your product. Why?” ?
It’s awesome to pay a quick visit this web site and reading the views of all mates
regarding this post, while I am also keen of getting experience.
Introduction to Cohort Analysis for Startups | Jonathon Balogh
Hi there! I just wanted to ask if you ever have any problems with hackers?
My last blog (wordpress) was hacked and I ended up losing months of
hard work due to no backup. Do you have any methods to prevent hackers?
Introduction to Cohort Analysis for Startups | Jonathon Balogh
I think the admin of this site is really working hard for his website, because here every data is
quality based stuff.
I do not even know how I ended up here, but I thought this post was good.
I don’t know who you are but definitely you’re going to a famous
blogger if you aren’t already 😉 Cheers!
I ogni volta abituato a leggere Lampione nei giornali ,
ma ora come io sono un utente di web quindi da
ora sto usando netto articoli , grazie al web .
I know this web page gives quality depending articles and additional stuff, is there any other website which offers such stuff in quality?
Professionally established, designed, and marketed social media accounts such as Twitter and
Facebook allow skin care companies to build out their skin care communities.
Before diving into the world of web development, get in terms with jargons of the industry and there is much more to consider than determining
price. When you go to a website, you instantly get a feel for the business.
What i don’t understood is in fact how you’re
no longer actually much more neatly-favored than you
may be right now. You are very intelligent. You recognize thus considerably
when it comes to this topic, produced me in my opinion consider
it from numerous various angles. Its like men and women aren’t involved until it is one thing to
do with Lady gaga! Your individual stuffs nice. All the time take care of it up!
Hello there! This blog post could not bbe writtfen any better!
Looking aat this arrticle reminds me of my previous roommate!
He contfinually kept preaching about this. I aam going to send thhis article to him.
Pretty sure he’s going to have a great read. Many thanks for
sharing!
The debris container is easy to empty; there are no bags.
As I rinsed a couple of years of dust down the drain it was hard to not have a little splash up and become airborne.
Also, due towards the reality which the suction ability of this
Dyson DC25 all floors vacuum cleaner is fairly impressive, it has the capacity of
selecting up any form of filth from all varieties
of floors (that incorporates carpets, rugs, wood, and tiles) with ease.
you are actually a just right webmaster. The site loading speed is incredible.
It sort of feels that you’re doing any distinctive trick.
Moreover, The contents are masterpiece. you have performed a great process in this matter!
Excellent post. I was checking continuously this blog and I’m impressed!
Very useful information specifically the last part :
) I care for such information much. I was seeking this certain information for a
long time. Thank you and best of luck.
Excellent beat ! I would like to apprentice while you amend your site, how could i subscribe for a blog site?
The account aided me a acceptable deal. I had been tiny bit acquainted
of this your broadcast offered bright clear idea
Useful information. Lucky me I discovered your website accidentally, and I am stunned why this twist of fate
did not happened earlier! I bookmarked it.
What’s up, all is going nicely here and ofcourse every one is sharing data, that’s really excellent, keep up writing.
Thanks for a marvelous posting! I definitely enjoyed reading it, you are a great author.
I will make certain to bookmark your blog and will come
back very soon. I want to encourage you continue your great job,
have a nice afternoon!
This piece of writing will help the internet users for setting up new web site or
even a weblog from start to end.
Asking questions are really pleasant thing if you are not understanding anything entirely, however this paragraph gives good understanding yet.
Very nice post. I just stumbled upon your blog and wanted to
mention that I’ve really loved browsing your blog posts. In any case I’ll be subscribing for your rss feed and I am hoping you
write once more soon!
I visit every day a few web pages and sites to read posts, except this webpage gives feature based articles.
Pingback: Player Profiling – A Short Reading List | Game Analytics Resources v. Anders Drachen
Hi blogger, i found this post on 16 spot in google’s search results.
You should decrease your bounce rate in order to rank in google.
This is major ranking factor nowadays. There is very handy
wp plugin which can help you. Just search in google for:
Lilas’s Bounce Plugin
So, it is necessary that you plan your shoe budget before buying
one. All footwear at Bourne is hand-crafted especially by
Opanka construction and the use of adhesives and machinery is minimal while creating the
shoes, thus making the designs eco-friendly. The Fashion Industry is
totally focused on how people look and larger people do not figure on mainstream
fashion’s radar.
Pingback: Metrics, Metrics: Measure to optimize - How to Web
Kind 1 diabetics Need to know how a lot carbs they are consuming as it affects
their blood glucose level and that determines their insulin dosage.
Thanks https://kakoizgubititezinu.wordpress.com/
Also, they have ruled the market due to their anatomical constructions of shoes that
make the shoes anti-stress with special shock absorption system.
You should always seek advice from someone
who has purchase the original boots before. Toe Size: The right shoe will not only fit well but will also be flexible in the toe area, with enough
space for your feet to relax, without being pinched in very tight.
Hola! Gracias poor esta información. Llevaba un rato buscando por laa red sobre este tema
hasta que he encontrado tu página web. Está muy bien el artículo.
Prosigue de esta forma!
Hello! For sites that do cohort analysis, do they cache each cell in the table in the db or generate the statistic on the fly? By the way the best paper writing service that I saw: http://speedypaper.net/
Metal is the element of this sector, and would
attract positive Ch’i. If (based on their individual
energies) most of the party is fire (as an example), we may want
to downplay the color red. Water fountains are basically put under the water just to make the overall premises stunning or lucrative.
Pingback: Understanding Cohort Analysis - Startups & Marketing Blog
Pingback: User Behavioural Analytics – Yong Liu – Writing for Learning and Sharing
Thanks very valuable. Will share site with my pals. http://bit.ly/2f0xJ92
First off I would like to say superb blog! I had a quick question which I’d like
to ask if you do not mind. I was interested to know how you center yourself and clear your head before writing.
I’ve had a difficult time clearing my mind in getting my
ideas out. I truly do enjoy writing but it just
seems like the first 10 to 15 minutes are wasted just trying to figure out how to
begin. Any suggestions or hints? Cheers!
Pingback: Start up res - My Notebook
Pingback: Understanding Cohort Analysis | Amarnath Vannarath
Pingback: Wildlife Studios: Why Your Studio Needs Data Scientists – Technology Blog
Pingback: User Behavioural Analytics – Writing for Learning and Sharing
Pingback: Using Customer Cohort Analysis to Optimize the Customer Experience | HockeyStack