
Cohort analysis example: engagement
Never use analytics to track information that uniquely identifies a particular person, including their real name, email address or IP. It’s not only against Google Analytics’ terms of service, it’s also a lousy and unnecessary violation of privacy.
Most cohort analysis is based on users grouped by a common date range. We do this to see if their behavior from one period to the next has changed. It’s also possible to group users based on other attributes that they share, such as membership level or achieved goals. The objective is to learn whether users with this attribute tend to achieve our product goals at a significantly different rate than a baseline cohort over time.
What types of data should we track? This depends on the type of product you have and the level of detail you need. Ask yourself: what are the long term attributes of your users that Google Analytics doesn’t provide? Which properties best differentiate your users and are most relevant to your product? What questions are you trying to answer?
| User attributes | |
|---|---|
| Good examples | total downloads, donated, sign up date, Klout score, gender, membership type, games played, referred friend, test group |
| Bad examples | number of visits, location, browser, referer, number of pageviews, IP address, last name |
Yes, there are exceptions to virtually every one of those examples. Use your judgement. If it’s important for you to know the number of people who started with Internet Explorer last year but are using Chrome this year then go ahead and record the user’s “Initial Browser”, for example.
> An aside: Aren’t there better ways to do this?
Blog example: Guido’s Mosquitos
I find things much easier to understand when looking at a real world situation. Let’s try a quick tutorial showing how you might use cohort analysis in Google Analytics to track engagement. Imagine your product is a blog advocating respect for your friend, the misunderstood mosquito. Your goal for “Guido’s Mosquitos” is to understand how well you retain your readers as well as record a few goals that they might reach on your site. In this case, you need to decide which cohort retention intervals you care about and which goals matter most. Let’s start with something like this:
Data layout:
| Slots | Purpose | Example data | Description |
|---|---|---|---|
| Slot 1 | Signup date | 20111019 | Date of user’s first visit |
| Slot 2 | Weekly cohort | 42 | Week of user’s first visit |
| Slot 3 | Ebook downloads | 3 | Number of ebooks downloaded |
| Slot 4 | Goal tracking | RefSent | User referred a friend |
It’s a new year and you’re considering adding more ebooks for readers to download from your blog. However, you only want to do so if it’s likely to increase donations. How do you proceed? In this case, the cohort, the group of people you’re most interested in, is made up of users who have downloaded at least x of your ebooks. You don’t care when they started coming to your site, or even how long they stayed, just that they engaged in an activity of interest to you.
| Advanced segment | Match conditions |
|---|---|
| “Cohort: 0 downloads” | Custom var: 3 Matching RegExp: ^0$ |
| “Cohort: 1 download” | Custom var: 3 Matching RegExp: ^1$ |
| “Cohort: 2+ downloads” | Custom var: 3 Matching RegExp: ^[2-9]$ |
With this segmentation you can jump over to an appropriately configured custom report and attempt to answer your initial question. For example, you might try to plot the number of goals achieved (donations) by each of the 3 user segments during the last couple months of the year.
-
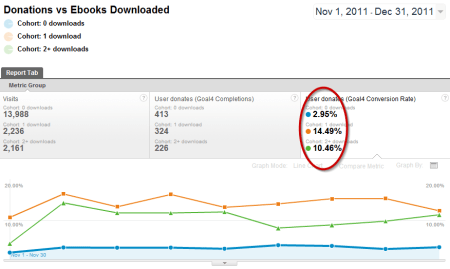
- Users are more engaged after downloading one ebook but additional downloads aren’t as beneficial
Aak! The abundance of ebooks is killing your business! Ok, not really. This is a rather limited analysis and it’s important that we understand exactly what it says. Looking at the “Cohort: 1 download” segment, for example, the results might be read something like this: 14.49% of users who downloaded exactly 1 ebook made a donation in the last 2 months. These users may have downloaded their one ebook during the analysis period or any time before that.

What we are trying to do is establish a correlation between our test segments (users who download ebooks) and our target goals (in this case, donations). The graph suggests that those who download ebooks are significantly more likely to donate but that those who download 1 ebook are just as likely to donate (if not more) as those who download 2 or more. The graph says nothing about why this is the case. Perhaps each of the downloaded ebooks repeat the same message and you’re boring your audience to tears. I don’t know. A more detailed attribution analysis would be required. But the investigation here should at least make you stop and think: maybe I should investigate this further before adding more ebooks, or perhaps there’s a better way to increase donations (preferably one with more promising data).

Pingback: Introduction to Cohort Analysis for Startups | Jonathon Balogh
Pingback: How to learn about your customer behaviour and engagement | Farbey's Notes
Pingback: Quora
Pingback: Quora
Pingback: How Does Mixpanel Compare to Google Analytics? | Jonathon Balogh
Pingback: Cohort analysis in a nutshell | A blog about behavioral economics, crowdfunding, crowdsourcing, gamification and more
Great post. What I feel is missing (in GA, not in your post) is the ability to `get` a visitor-level custom variable, or alternatively, to only set a custom variable if it’s not already set.
Unless I’m missing something obvious, that would make the implementation of cohort analysis in GA – specifically, setting the starting date – way easier. I guess you could dive into the cookies, but this sounds awful to me.
Ok, so it turns out, there actually is a `_getVisitorCustomVar()` function!
See: http://stackoverflow.com/questions/13181514/access-previously-stored-visitor-level-custom-variable
Thanks, I was searching for just that. Couldn’t find it in googles doc.
I wanted to only set a visitor-level customer variable if it was not already set. This way I have start date for my first time visitors.
What I did was check if my visitor-level variable “Start Date” was set and if it wasn’t I would appoint the day’s date to this variable.
The _gaq.push looks like this:
_gaq.push(function() {
var pageTracker = _gat._getTrackerByName(); // Gets the default tracker.
var VisitorCustomVar = pageTracker._getVisitorCustomVar(1);
var push_content = [‘_setCustomVar’, 1, ‘Start Date’, ‘{{ analytics_startdate }}’, 1];
if (!VisitorCustomVar) {
return push_content;
}
return false;
});
We get the visitor custom variable with the _getVisitorCustomVar(1) function where 1 is the index of our custom variable. Then we check if this variable already exist and if it doesn’t we set a new variable(through the push_content array)
Pingback: Metrics | Annotary
Pingback: The Scrappy Mofo’s Guide to Advanced Segmentation | iAcquire Blog
Pingback: Google Analyticsを使ったコホート分析で施策の有効性を検証する | @takatama_jp
I loved the introduction to cohort analysis but this is even better! Thanks!
Pingback: The Scrappy Mofo’s Guide to Advanced Segmentation »
Thanks for this three posts!! They are really straight forward and absolutely awesome!!
I see a lot of interesting articles on your page.
You have to spend a lot of time writing, i know how to save you a lot of time, there is a tool that creates unique, SEO friendly posts in couple of minutes, just
search in google – k2 unlimited content
Thanks for the great article. 🙂
I think this is the best article I’ve seen on how to track retention data using Google analytics.
Any idea whether it would work on mobile apps in the same manner?
I’m guessing it will, but it would be great if can be said by someone who actually tried this.
I read a lot of interesting content here. Probably you spend a lot
of time writing, i know how to save you a lot of work,
there is an online tool that creates unique, google friendly posts in minutes, just search in google – laranitas free
content source
Have you ever considered writing an e-book or guest authoring on other sites?
I have a blog centered on the same information you discuss and would love to have you share some stories/information. I know my audience would value your work.
If you’re even remotely interested, feel free to shoot me an e mail.
Hello there! I know this is kinda off topic but I was wondering which
blog platform are you using for this website? I’m getting sick and tired of WordPress because I’ve had problems
with hackers and I’m looking at options for another platform.
I would be fantastic if you could point me in the direction of a good platform.
Good day! Do you know if they make any plugins to help with SEO?
I’m trying to get my blog to rank for some targeted keywords but I’m not seeing very good success.
If you know of any please share. Thanks!
Just wish to say your article is as astonishing.
The clearness to your post is just excellent and that i
could assume you’re a professional in this subject.
Well together with your permission let me to grab your feed
to keep up to date with approaching post. Thank you one million and please
keep up the gratifying work.
Have you ever considered writing an e-book or
guest authoring on other websites? I have a blog centered on the same topics you discuss and would love to have you share some
stories/information. I know my viewers would value your work.
If you’re even remotely interested, feel free to shoot
me an e-mail.
hello there and thank you for your info – I have definitely picked up
anything new from right here. I did however
expertise several technical points using this website, since I experienced to reload
the web site lots of times previous to I could get it to load properly.
I had been wondering if your web hosting is OK? Not that I am complaining, but sluggish
loading instances times will sometimes affect your placement in google and could damage your quality
score if advertising and marketing with Adwords.
Well I’m adding this RSS to my email and can look out for a lot more of
your respective fascinating content. Make sure you update this again very soon.
My family members always say that I am killing my time here at net, except I know I am getting experience all the time
by reading such good content.
An outstanding share! I’ve just forwarded this onto a co-worker who
had been doing a little homework on this. And he actually bought me dinner simply because I discovered it for him…
lol. So let me reword this…. Thanks for the meal!! But yeah, thanks for spending the time to discuss this subject here on your internet site.
That is very fascinating, You’re an overly skilled blogger.
I have joined your feed and sit up for seeking more of your
fantastic post. Also, I’ve shared your website in my social networks
Great post. I was checking continuously this blog and I am impressed!
Very helpful info specially the last part 🙂 I care for such info a lot.
I was seeking this particular information for a long time.
Thank you and best of luck.
If some one wants to be updated with latest technologies afterward he must be pay a
quick visit this site and be up to date all the time.
You can certainly see your skills in the article you write.
The world hopes for even more passionate writers such as you who are not
afraid to say how they believe. At all times follow
your heart.
Way to analyze behavior by segmenting users into groups in analytics.
Way to analyze behavior by segmenting users into groups in analytics.
What a information of un-ambiguity and preserveness of valuable experience on the
topic of unpredicted emotions.
Pingback: User Behavioural Analytics – Yong Liu – Writing for Learning and Sharing
There’s definately a lot to know about this topic. I like all of
the points you made.
Grupo de discussão no Facebook para leitores do blog. https://breezylist.org/community/index.php?action=profile;u=198
I don’t know if it’s just me or if everybody else experiencing problems with your website.
It looks like some of the text in your posts are running off the screen. Can somebody else please comment and let me know if this is happening to them as well?
This may be a problem with my internet browser because I’ve had this happen previously.
Thanks
Pingback: User Behavioural Analytics – 未来科技,今日生活