
Cohort analysis example: retention
Reading about what to do is really boring so let’s walk through another example. We’ll start with the simplest case: you’re a startup entrepreneur interested in tracking the retention of your users by month. You’ve been struggling to bring people back to your product for a while. After some rather sweet changes to your site in October you’re anxious to see if the stickiness has improved. Are visitors now more compelled to make return visits?
1. Decide what to track
Persistent tracking data is recorded as a string in 1 of 5 custom variables that Google Analytics stores in their __utmv tracking cookie. You can structure your data in whatever representation is most convenient. Two things to keep in mind are that there are limited slots available and you probably want a format that makes it easy to extract the relevant data later. The table below shows a variety of ways you might encode the date that new users arrive. This example shows users who make their first visit to your product on October 19th, 2011.
| Example | Slot 1 | Slot 2 |
|---|---|---|
| 1 | October | 19 |
| 2 | 20111019 | – |
| 3 | Y2011M10W42D292 | – |
| 4 | 1142 | 292 |
The examples all store the day of the month but this isn’t strictly needed if you only care about monthly tracking. As you can see in options 3 and 4, if you want to group users by day and week you might consider using the day (292) and week (42) index of the year. We’ll use the format in example 2 for this discussion.
2. Write the data
In this step you’ll need to add some JavaScript to your site. LunaMetrics has a nice overview of custom variables and how to set them up for your site.
On each new visit/signup you’ll call _setCustomVar with the appropriate parameters:
Method: _setCustomVar(index, name, value, opt_scope)

Example: _gaq.push(['_setCustomVar', 1, 'Start Date', '20111019', 1]);
When the user arrives for the first time you’ll record their “Start Date” in custom variable 1. The fourth parameter indicates that we are using the slot for visitor-level (cookie) tracking.
3. Segment the results
For each cohort group you’ll likely want to define an advanced segment in Google Analytics to simplify analysis. This may require a regex condition (which are worth learning). Segmenting users by month and year is a little simpler:
| Cohort group | Segment name | Match conditions |
|---|---|---|
| All users whose first visit was in 2011 | “Cohort: 2011” | Custom var: 1 Containing: 2011 |
| All users whose first visit was in October 2011 | “Cohort: October 2011” | Custom var: 1 Containing: 201110 |
With custom variable 1, your advanced segment condition would look like this in Google Analytics:

Using regular expressions you can get a little more fancy:
| Cohort group | Segment name | Match conditions |
|---|---|---|
| All users whose first visit was in the summer of 2011 | “Cohort: Summer 2011” | Custom var: 1 Matching RegExp: ^20110[6-8] |
| All users whose first visit was the week before Christmas | “Cohort: Dec 18-24” | Custom var: 1 Matching RegExp: ^201112(1[89]|2[0-4]) |
4. Analyze with reports
It’s time to pull up a report and look proudly upon our new cohort creations. This is what the Audience Overview screen in Google Analytics would look like after turning on the September, October and November cohort segments:
-
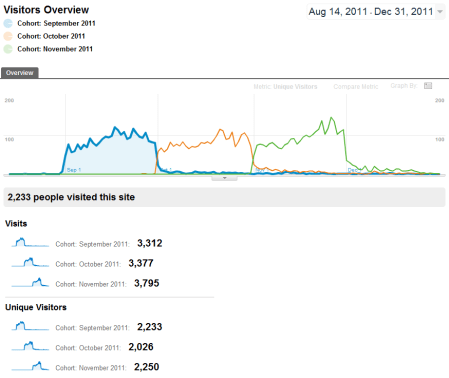
- Cohort example showing visitor counts for each of 3 months
Success! But we need more than pretty graphs. What, exactly, was the one month retention for these 3 months? Is it getting better? For example, how many of the people who first visited in September returned at least once in the following month (October)?
-

- A cohort study can show how many new visitors in September returned in October
Let’s start with how many users visited for the first time in September. By definition, that should include all visitors that are within the cohort. According to the first screenshot in this section, the number of uniques in the September cohort is 2233. Those users checked out your product in September but how many came back in October?
-
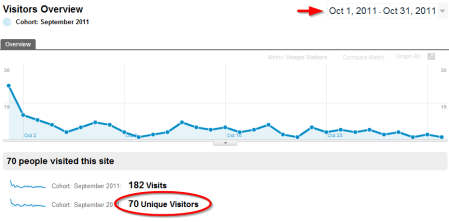
- The long tail of users who returned in October. Too bad it’s so thin.
Ouch. Only 70 visitors from the September cohort returned at least once in October. The one month retention for September was 70/2233 = 3.1%. Are you OK with that? For most online products that’s a pretty abysmal retention rate. Similarly we can calculate retention values for October and November.
| September | October | November | |
|---|---|---|---|
| Visitors | 2233 | 2026 | 2250 |
| Returned next month | 70 | 122 | 145 |
| Retention | 3.1% | 6.0% | 6.4% |
Engagement and retention often correlate. For example, visitors that interact and spend time with a product tend to return. But not always. Some products, like search engines, naturally tend to have high retention but low engagement. Others may do better at engaging their audience for long periods but don’t see them visit as often. Facebook is an example of a product that both engages and retains its users.
Hey, look at you! Those changes you made in October have doubled your retention! It’s gone from crappy to just plain lousy! Don’t get too excited – you have no idea if your changes were responsible for this rise. At the very least you would want to see if the trend continued over the next few months.
While you’re poking around Google Analytics with your finely sliced cohort segments you may want to explore some of the other reports. For example, how do your cohorts compare based on your conversion goals? What can you learn by applying the segments to your favorite custom reports? There’s a lot of insight potential here. For example, the Audience Overview report that we were just looking at from Aug 14 – Dec 31 shows a couple of engagement metrics (pages/visit and avg time on site). Do those match what you would expect based on the retention values we just calculated above? They might not.
Pulling your cohort data through the Google Analytics API is another option for analysing your results but that’s a bit more work. You may also want to consider using the Google Analytics Data Feed Query Explorer. Nice name, eh? This tool is actually pretty handy for getting exactly the information you need without having to navigate the Google Analytics web interface.
> An aside: Can you trust these numbers?

Pingback: Introduction to Cohort Analysis for Startups | Jonathon Balogh
Pingback: How to learn about your customer behaviour and engagement | Farbey's Notes
Pingback: Quora
Pingback: Quora
Pingback: How Does Mixpanel Compare to Google Analytics? | Jonathon Balogh
Pingback: Cohort analysis in a nutshell | A blog about behavioral economics, crowdfunding, crowdsourcing, gamification and more
Great post. What I feel is missing (in GA, not in your post) is the ability to `get` a visitor-level custom variable, or alternatively, to only set a custom variable if it’s not already set.
Unless I’m missing something obvious, that would make the implementation of cohort analysis in GA – specifically, setting the starting date – way easier. I guess you could dive into the cookies, but this sounds awful to me.
Ok, so it turns out, there actually is a `_getVisitorCustomVar()` function!
See: http://stackoverflow.com/questions/13181514/access-previously-stored-visitor-level-custom-variable
Thanks, I was searching for just that. Couldn’t find it in googles doc.
I wanted to only set a visitor-level customer variable if it was not already set. This way I have start date for my first time visitors.
What I did was check if my visitor-level variable “Start Date” was set and if it wasn’t I would appoint the day’s date to this variable.
The _gaq.push looks like this:
_gaq.push(function() {
var pageTracker = _gat._getTrackerByName(); // Gets the default tracker.
var VisitorCustomVar = pageTracker._getVisitorCustomVar(1);
var push_content = [‘_setCustomVar’, 1, ‘Start Date’, ‘{{ analytics_startdate }}’, 1];
if (!VisitorCustomVar) {
return push_content;
}
return false;
});
We get the visitor custom variable with the _getVisitorCustomVar(1) function where 1 is the index of our custom variable. Then we check if this variable already exist and if it doesn’t we set a new variable(through the push_content array)
Pingback: Metrics | Annotary
Pingback: The Scrappy Mofo’s Guide to Advanced Segmentation | iAcquire Blog
Pingback: Google Analyticsを使ったコホート分析で施策の有効性を検証する | @takatama_jp
I loved the introduction to cohort analysis but this is even better! Thanks!
Pingback: The Scrappy Mofo’s Guide to Advanced Segmentation »
Thanks for this three posts!! They are really straight forward and absolutely awesome!!
I see a lot of interesting articles on your page.
You have to spend a lot of time writing, i know how to save you a lot of time, there is a tool that creates unique, SEO friendly posts in couple of minutes, just
search in google – k2 unlimited content
Thanks for the great article. 🙂
I think this is the best article I’ve seen on how to track retention data using Google analytics.
Any idea whether it would work on mobile apps in the same manner?
I’m guessing it will, but it would be great if can be said by someone who actually tried this.
I read a lot of interesting content here. Probably you spend a lot
of time writing, i know how to save you a lot of work,
there is an online tool that creates unique, google friendly posts in minutes, just search in google – laranitas free
content source
Have you ever considered writing an e-book or guest authoring on other sites?
I have a blog centered on the same information you discuss and would love to have you share some stories/information. I know my audience would value your work.
If you’re even remotely interested, feel free to shoot me an e mail.
Hello there! I know this is kinda off topic but I was wondering which
blog platform are you using for this website? I’m getting sick and tired of WordPress because I’ve had problems
with hackers and I’m looking at options for another platform.
I would be fantastic if you could point me in the direction of a good platform.
Good day! Do you know if they make any plugins to help with SEO?
I’m trying to get my blog to rank for some targeted keywords but I’m not seeing very good success.
If you know of any please share. Thanks!
Just wish to say your article is as astonishing.
The clearness to your post is just excellent and that i
could assume you’re a professional in this subject.
Well together with your permission let me to grab your feed
to keep up to date with approaching post. Thank you one million and please
keep up the gratifying work.
Have you ever considered writing an e-book or
guest authoring on other websites? I have a blog centered on the same topics you discuss and would love to have you share some
stories/information. I know my viewers would value your work.
If you’re even remotely interested, feel free to shoot
me an e-mail.
hello there and thank you for your info – I have definitely picked up
anything new from right here. I did however
expertise several technical points using this website, since I experienced to reload
the web site lots of times previous to I could get it to load properly.
I had been wondering if your web hosting is OK? Not that I am complaining, but sluggish
loading instances times will sometimes affect your placement in google and could damage your quality
score if advertising and marketing with Adwords.
Well I’m adding this RSS to my email and can look out for a lot more of
your respective fascinating content. Make sure you update this again very soon.
My family members always say that I am killing my time here at net, except I know I am getting experience all the time
by reading such good content.
An outstanding share! I’ve just forwarded this onto a co-worker who
had been doing a little homework on this. And he actually bought me dinner simply because I discovered it for him…
lol. So let me reword this…. Thanks for the meal!! But yeah, thanks for spending the time to discuss this subject here on your internet site.
That is very fascinating, You’re an overly skilled blogger.
I have joined your feed and sit up for seeking more of your
fantastic post. Also, I’ve shared your website in my social networks
Great post. I was checking continuously this blog and I am impressed!
Very helpful info specially the last part 🙂 I care for such info a lot.
I was seeking this particular information for a long time.
Thank you and best of luck.
If some one wants to be updated with latest technologies afterward he must be pay a
quick visit this site and be up to date all the time.
You can certainly see your skills in the article you write.
The world hopes for even more passionate writers such as you who are not
afraid to say how they believe. At all times follow
your heart.
Way to analyze behavior by segmenting users into groups in analytics.
Way to analyze behavior by segmenting users into groups in analytics.
What a information of un-ambiguity and preserveness of valuable experience on the
topic of unpredicted emotions.
Pingback: User Behavioural Analytics – Yong Liu – Writing for Learning and Sharing
There’s definately a lot to know about this topic. I like all of
the points you made.
Grupo de discussão no Facebook para leitores do blog. https://breezylist.org/community/index.php?action=profile;u=198
I don’t know if it’s just me or if everybody else experiencing problems with your website.
It looks like some of the text in your posts are running off the screen. Can somebody else please comment and let me know if this is happening to them as well?
This may be a problem with my internet browser because I’ve had this happen previously.
Thanks
Pingback: User Behavioural Analytics – 未来科技,今日生活